Less noise at 2 a.m.
PortStitch uses the site map to group downstream failures into the upstream incident. Your on call technician gets the page that matters.

Monitoring for networks that don’t fit in one portal
PortStitch connects the devices, servers, and vendors across your sites. When something breaks, your team sees the likely cause and the evidence behind it, without a page for every device downstream.
For MSPs and multi site IT teams.
Designed for the mixed networks you already run
THE PROBLEM
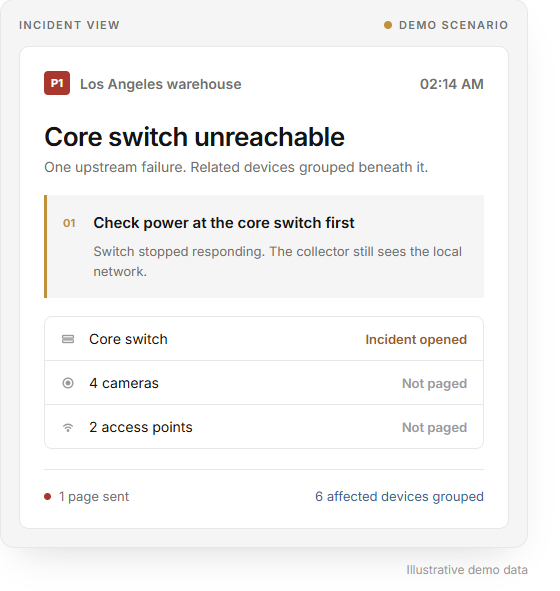
When a switch goes down, the cameras, access points, and scanners behind it appear to fail too. Your team needs to know what started the outage, not read the same outage twenty times.
PortStitch uses the site map to group downstream failures into the upstream incident. Your on call technician gets the page that matters.
Observed facts, likely causes, ruled out causes, and a check first list help the tech arrive ready.
See the path from a Cato Socket through an Extreme switch to a Meraki access point in one site map.
THE DIFFERENCE
An on site collector keeps recording while the internet connection is down. When the link returns, it uploads what happened inside the site. That history helps separate an ISP failure from a local power or network failure.
Explore the setupHOW IT WORKS
Use a collector, a server agent, and vendor cloud connections where they make sense. PortStitch brings their signals together in a live site map.
Network devices, switch ports, power, and local visibility during an internet outage.
Windows and Linux health, services, disk, and web checks.
Vendor APIs for branches and cloud resources, with no hardware needed at a cloud only site.
WHAT YOU CAN SEE
Find the affected port, understand the cause, and give the next person a clear account of what happened.
Upstream failures bring related devices into one incident. Business hours, priorities, and maintenance windows guide paging.
See observed facts and their sources, likely and possible causes, ruled out causes, and what to check first.
Search a MAC, IP, or hostname to find its switch port, VLAN, path, and movement history.
View device connections, cameras and doors, wireless, UPS runtime, and switch ports with PoE draw.
Review configuration backups and compare changes alongside Meraki and Cato activity.
Monitor Windows and Linux health. Start the day with a morning briefing and connect tickets to Freshservice or Atera.
Product views use simulated site data in the current demo.
WHO IT’S FOR
Keep clients separate, set hours and priorities for each one, send tickets into your existing workflow, and start the morning with a useful briefing.
Request a demoBring packhouses, cold storage, distribution centers, and newly acquired sites into a single map even when the vendors differ.
Request a demoSECURITY BY DESIGN
PortStitch was designed for teams that need useful visibility without inbound access to client networks.
SEE PORTSTITCH IN ACTION
See how PortStitch maps a switch failure, groups the affected devices, and gives your team evidence to check first. Tell us about the sites and vendors you manage, and we will follow up to arrange a demo.